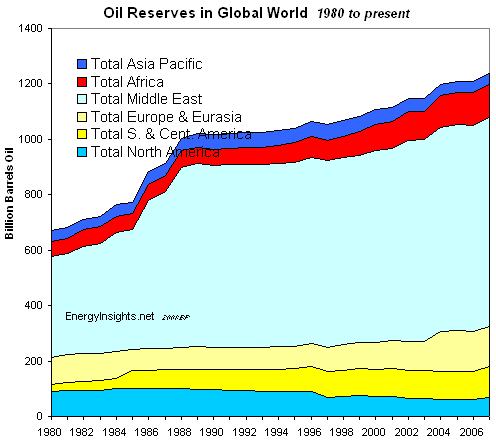
| Global Oil Reserves Per Region - since 1980 |
 |
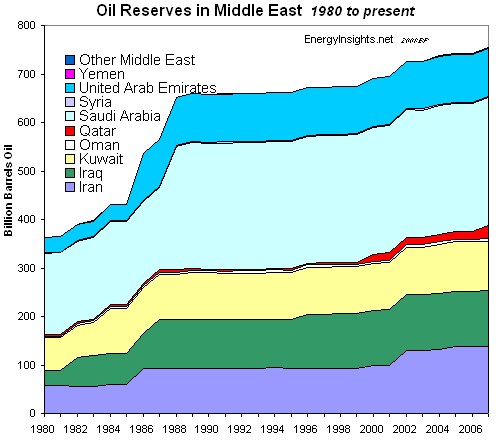
| Oil Reserves Middle East region - since 1980 |
 |
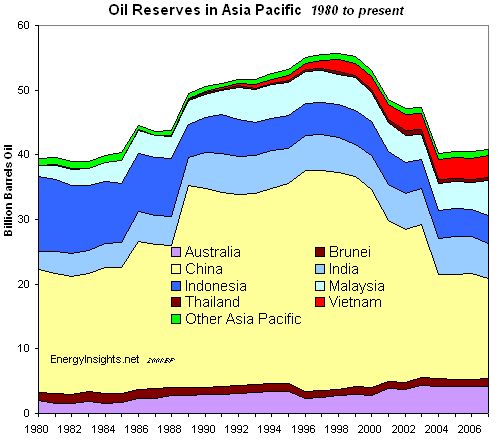
| Oil Reserves Asia Pacific region - since 1980 |
 |
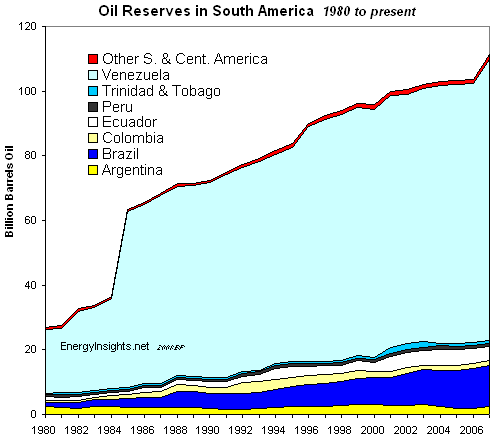
| Oil Reserves South America region - since 1980 |
 |
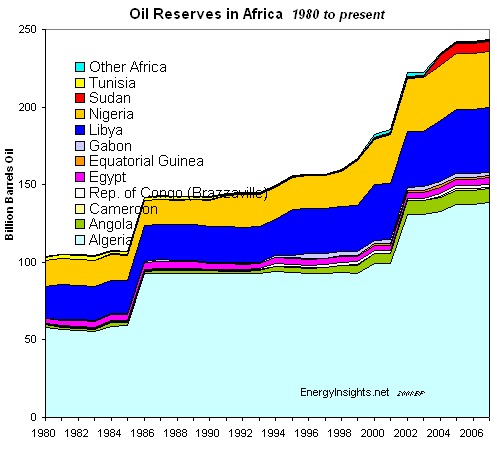
| Oil Reserves Africa region - since 1980 |
 |
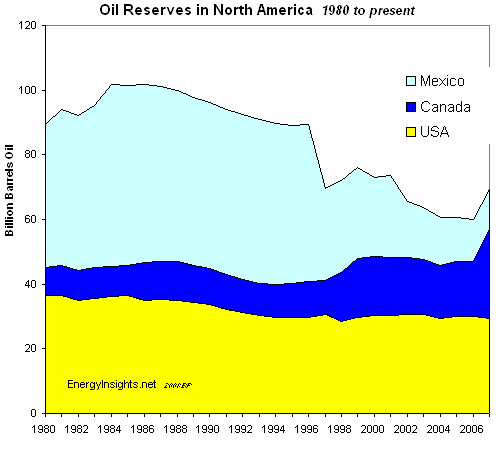
| Oil Reserves North America region - since 1980 |
 |
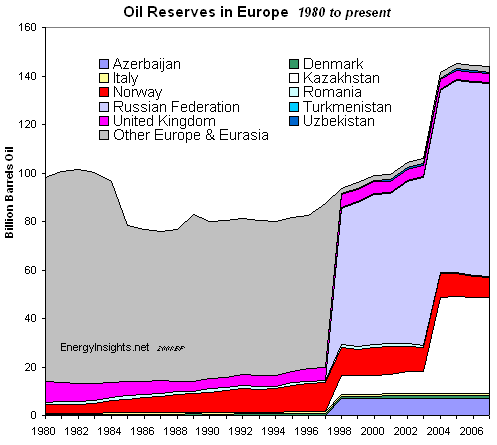
| Oil Reserves Europe region (including Russia) - since 1980 |
 |
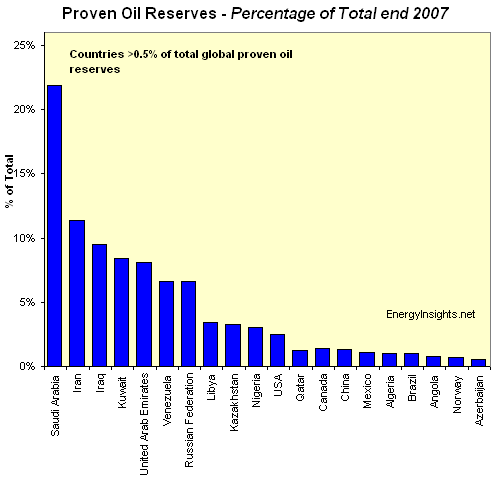
| Proven Oil Reserves - in major countries by reserves size at end 2007 |
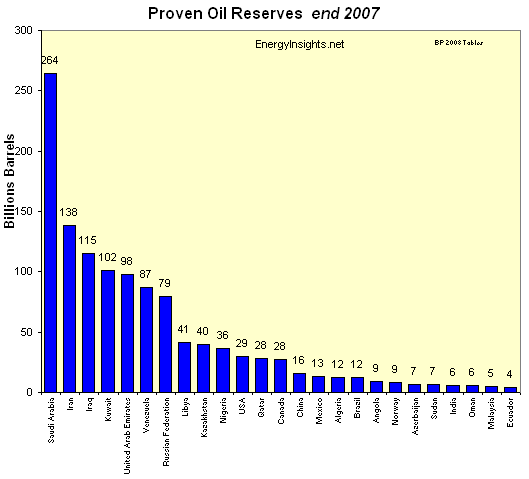 |
| Proven Reserves - major countries (top 20) by reserves size |
 |
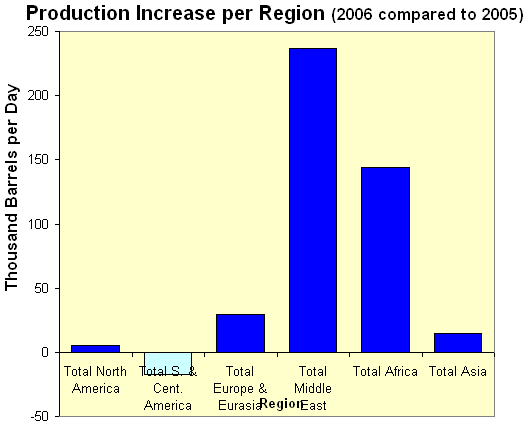
| Oil Production Increase - per region in 2006 compared to 2005 - in barrels per day - note remarkable stability as a percentage when considering the total world oil prdoction of ca. 85 million barrels per day |
 |
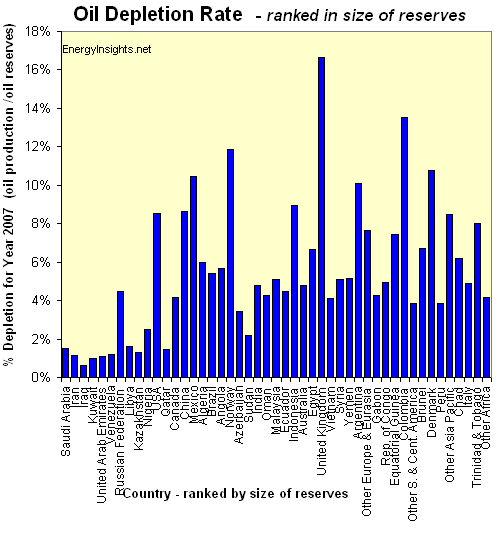
| Oil Depletion Rates - ranked by size of reserves - the highest reserves are to the left and lowest to the right - in major countries by reserves countries - as of end 2007. UK has highest depletion rate of 17% with Saudi Arabia, Iran, Iraq and Kuwait the lowest at 1-2% per annum (implying ca. 50 to 100 years of production at current rates). |
 |
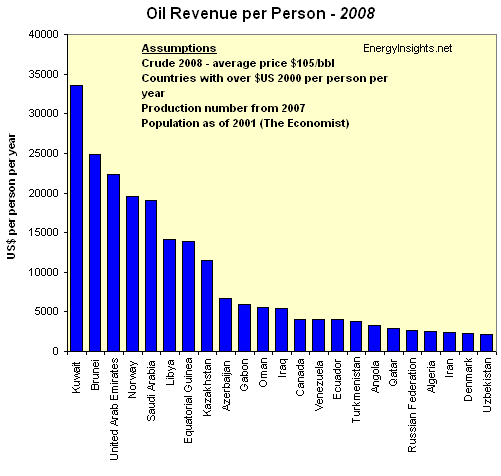
| Oil Revenue Per Person per Country in 2008 - in major countries by reserves size. Note at ca. $105/bbl average in 2008, Kuwait delivered a sttaggering $33,500 per person. Brunei follws with $25,000 then UAE and Norway - at around $20,000 per person. These are some of the richest countries in the world if oil prices rise above ca. $50/bbl. |
 |
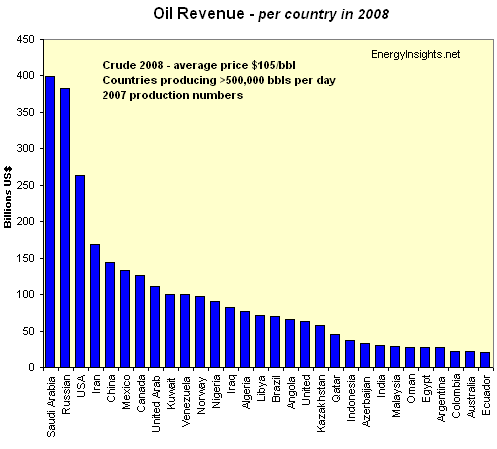
| Oil Revenue per Country in 2008 - in major oil producing countries. Note Saudi Arabia and Russia head the list with production at ca. 9.5 million barrels a day. Both countries export most of their oil. USA is third but is a large net importer of ca. 8 million barrels a day. |
 |
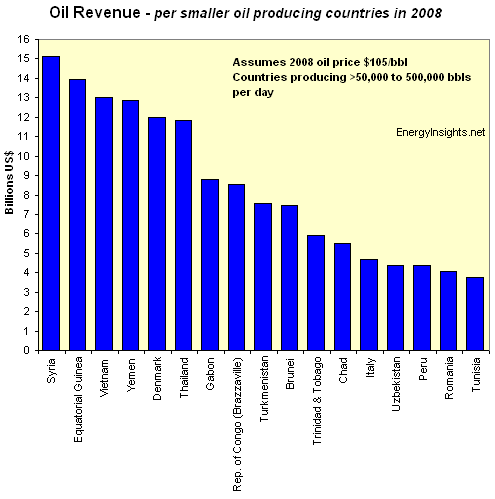
| Oil Revenue per Smaller Oil Producting Country in 2008 - in major oil producing countries (note: gross produced revenue, not net or net exported revenue or profit). Based on 2008 oil price and 2007 oil production. |
 |
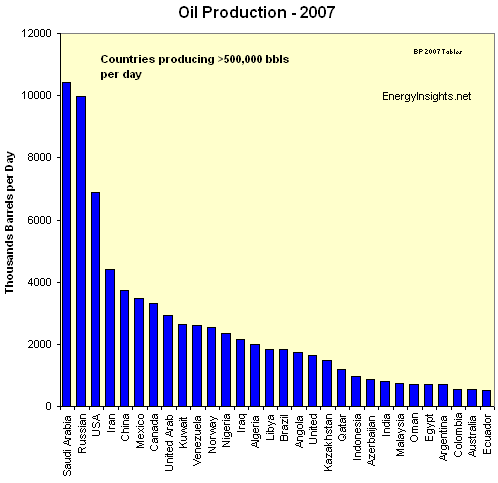
| Oil Production per Country in 2007 - in major oil producing countries. Note Russia and Saudi Arabia are the biggest oil producers. Followed by USA. However, USA importa ca. 8 million barrels a day, whilst Saudi exports the bulk of it's oil. |
 |
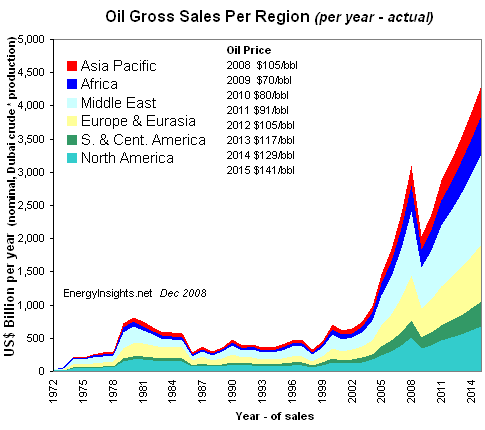
| Gross Oil Sales Per Region - 1972 to present, and forecast to 2015 based on the below oil price forecast. This chart shows the total region's oil production multiplied by the average oil price in that year (benchmarked to Dubai price). Note - the price forecast is uncertain, but with prices crashing from $147/bbl to $33/bbl from July 2008 to Dec 2008, we expect prices to recover as the recession ends - thence tightening of supply and increase in demand to drive up prices end 2009. |
 |
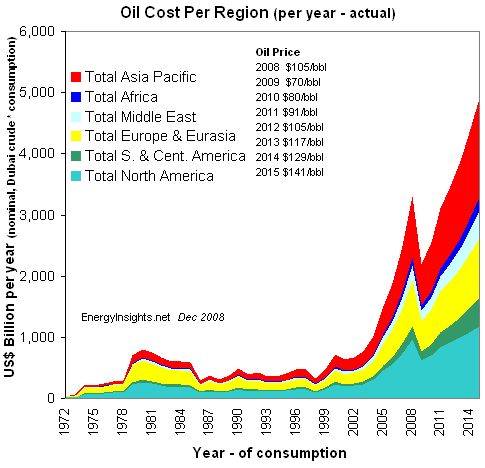
| Cost of Oil Per Region - 1972 to present, and forecast to 2015 based on the below oil price forecast. This chart shows the total region's oil cost - this is the oil consumption multiplied by the average oil price in that year (benchmarked to Dubai price). Note - the price forecast is uncertain, but with prices crashing from $147/bbl to $33/bbl from July 2008 to Dec 2008, we expect prices to recover as the recession ends - thence tightening of supply and increase in demand to drive up prices end 2009. |
 |
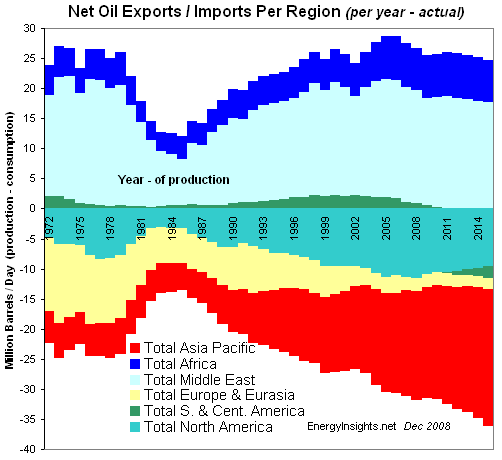
| Net Oil Exports and Imports Per Region - 1972 to present, and forecast to 2015. Note the massive Fast Eastern draw on oil in years to come. Europe region is only slightly negative only because Russia is added into this region. Middle East are the clear exporters - with Africa another net exporter (85% from Libya, Algeria, Nigeria and Angola). |
 |
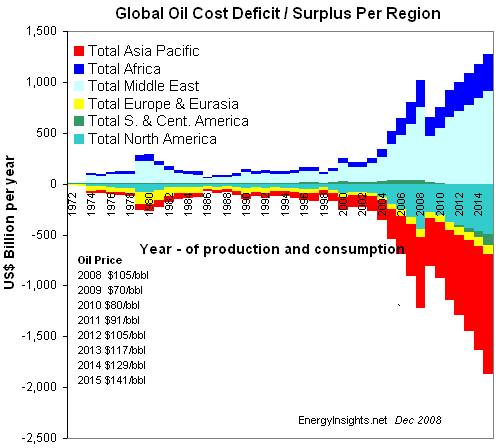
| Global Oil Cost Deficits and Surplus Per Region - 1972 to present, and forecast to 2015. Using historical oil prices before end 2008, and oil price forecast below up until 2015. Note recession impacts 2009 and 2010 - as Middle East cuts back oil and the oil price crashes, before recovering end of decade. |
 |
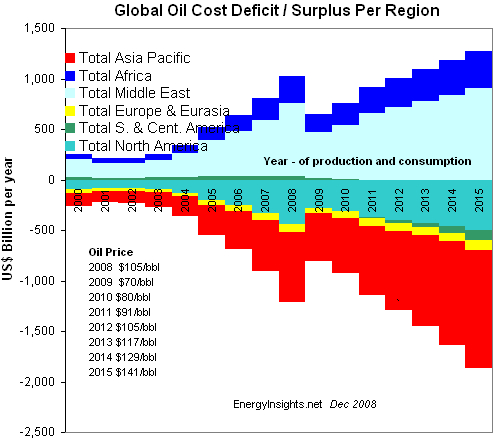
| Global Oil Cost Deficits and Surplus Per Region - 2000 to present, and forecast to 2015. Using historical oil prices before end 2008, and oil price forecast below up until 2015. Note recession impacts 2009 and 2010 - as Middle East cuts back oil and the oil price crashes, before recovering end of decade. |
 |
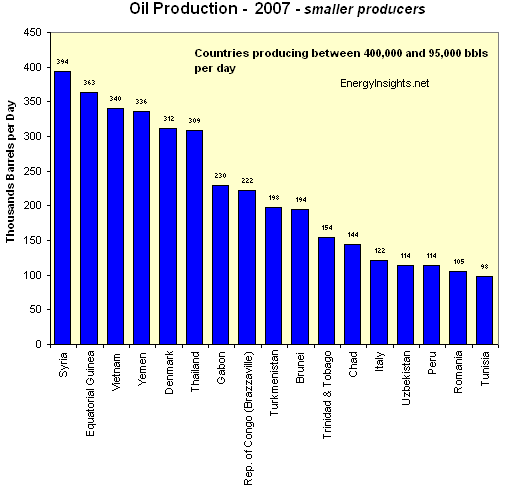
Oil Producing in Smaller Producing Country in 2007 |
 |
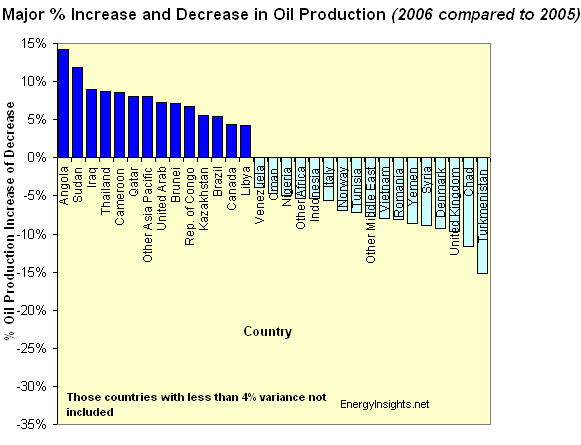
Oil Production - Major Percentage Increase and decrease - 2006 compared to 2005. Note Angola is the world biggest % increaser in oil production. This is likely to continue in 2008 and possible 2009. Chad is in decline as is UK and Turkmenistan - this is also likely to continue in 2008 and 2009. However, OPEC (mainly Middle Eastern) countries will cut back production end 2008 and early 2009. |
 |


Custom Search


Subscribe to:
Comments (Atom)
.jpg)


.bmp)


.jpg)

